Measuring fan engagement through behavioral signals
Measuring fan engagement through behavioral signals combines event data, sensor feeds, and interaction metrics to build a clearer picture of how audiences experience games and cultural events. By translating gestures, movement, attention, and physiological proxies into behavioral signals, organizations can better understand audience preferences, tailor experiences, and evaluate the impact of changes in real time.

Measuring fan engagement through behavioral signals means shifting from survey-driven snapshots to continuous, observable measures that reflect real-time attention, emotion, and participation. Instead of relying only on ticket sales or social mentions, teams and venues can use data streams coming from devices and cameras to infer how fans respond to plays, promotions, or in-venue amenities. Behavioral signals are raw or processed indicators — from gaze and movement to heart-rate variability proxies and app interactions — that, when combined, reveal patterns in attention, loyalty, and satisfaction.
Analytics: what behavioral signals matter?
Analytics defines which behavioral signals drive meaningful insights. Typical signals include dwell time in zones, app session lengths, applause and noise patterns, concession purchase timing, and repeat-visit frequencies. Aggregating these with segmentation (age groups, ticket types, or seating zones) provides context. Robust analytics pipelines filter noise, normalize across events, and derive composite engagement scores. These scores help compare different activations, broadcast segments, or promotional tactics. Ensuring privacy-preserving aggregation and clear consent practices is essential before analyzing behavioral signals.
Sensors and wearable tracking: what data is collected?
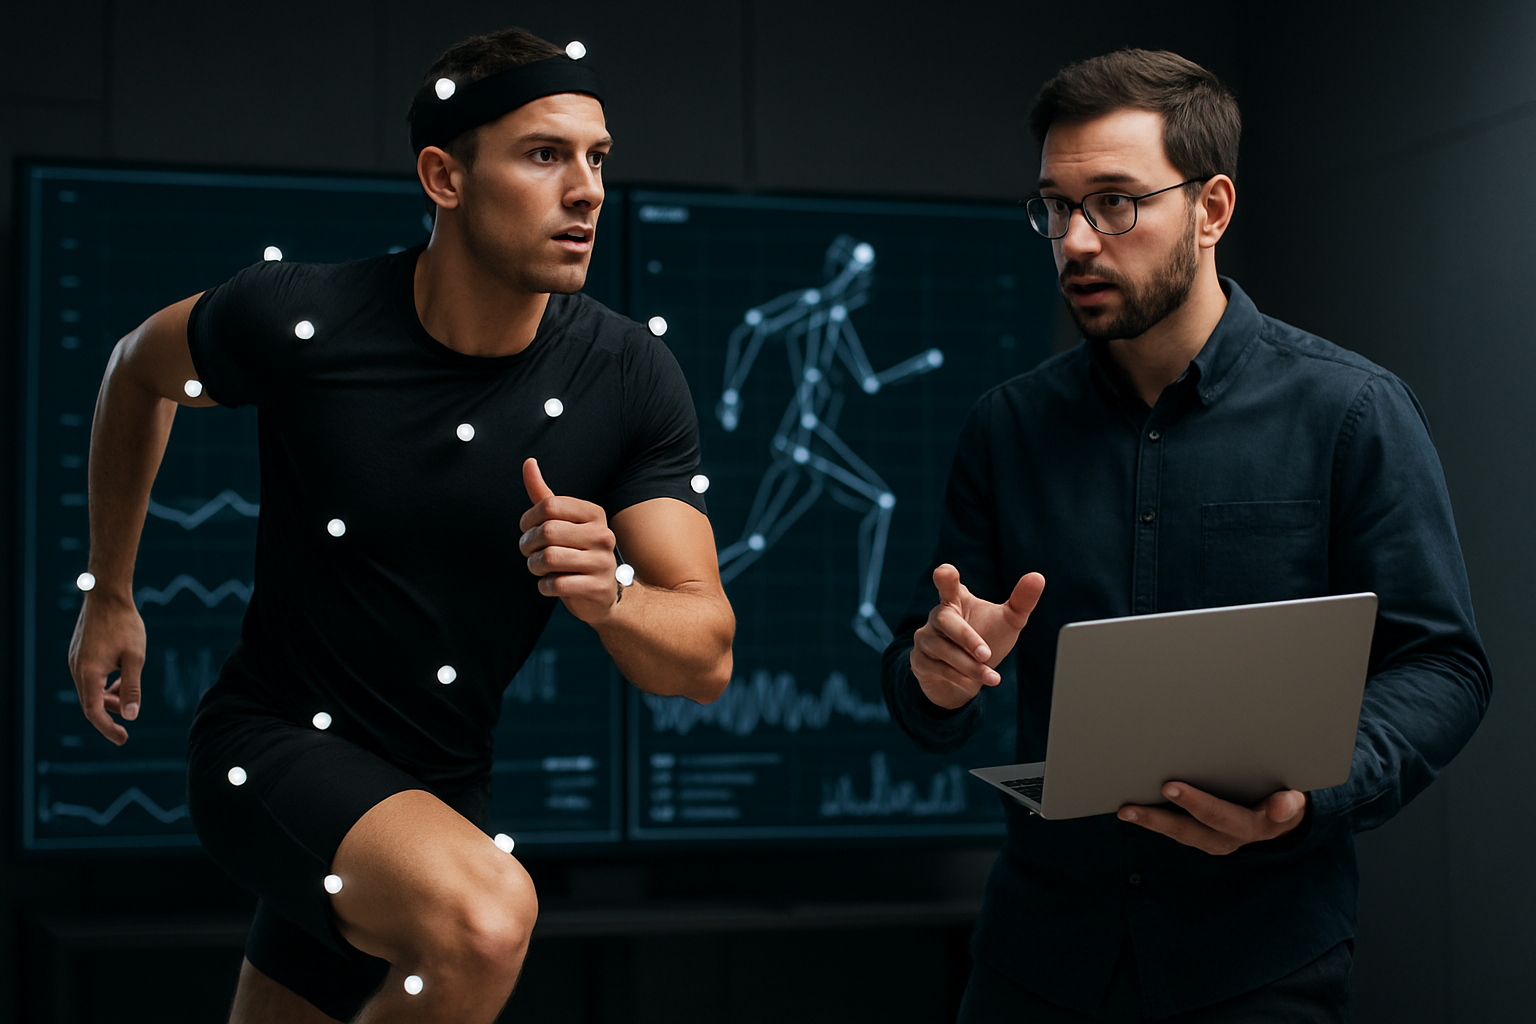
Sensors and wearable tracking capture movement and physiological proxies. In-venue sensors record footfall, queue length, and proximity interactions, while wearables and smart-ticket integrations supply motion patterns and voluntary biometric signals where consented. Tracking can identify high-interest locations and movement flows, which inform signage placement and staffing. Data quality depends on sensor calibration, sampling frequency, and battery life. Blending explicit interactions (app taps, AR activations) with passive sensing creates a fuller behavioral dataset without over-reliance on any single device.
Telemetry and visualization: how to interpret streams?
Telemetry streams deliver high-frequency metrics that need real-time and historical visualization. Dashboards that combine heatmaps, timeline plots of crowd noise, and funnels for ticket-to-concession conversion make telemetry actionable. Visualization simplifies anomaly detection — for example, sudden drops in attention during a broadcast break or spikes when a mascot appears. Contextual layers (game clock, score, and weather) help interpret telemetry. Visual tools should enable both operational responses during events and strategic analysis after, supporting A/B testing of experiences.
Biomechanics and performance: can player data inform fans?
Biomechanics and performance data focus on athlete movement and exertion but can also shape fan engagement. Fans tracking player workloads, speed bursts, or injury risk narratives may feel more connected, especially when such metrics are visualized in understandable ways. Integrating performance telemetry with commentary or interactive overlays creates deeper storytelling opportunities. However, translating biomechanics to fan-facing content requires careful simplification to avoid misinterpretation and to respect athlete privacy and competitive considerations.
Coaching, scouting, and tactics: how does engagement connect?
Coaching, scouting, and tactics influence the fan narrative around strategy. Fans engaged by tactical shifts or scouting insights respond differently than casual spectators. Behavioral signals — such as increased attention during a tactical video board segment or longer app dwell on play breakdowns — indicate appetite for deeper content. Teams can use these responses to schedule education sessions, create tactical explainer content, or tailor in-venue experiences that match fan sophistication. The link between tactical content and engagement can guide programming decisions across digital and physical channels.
Workload, injuries, and recovery: what signals affect interest?
Workload and injury news often drive spikes in engagement; fans follow recovery stories and load-management decisions closely. Signals that reflect this interest include increased search behavior, social interactions around injury reports, and elevated app consumption of medical updates or interviews. Conditioning and recovery content that demystifies processes can sustain engagement over long seasons. Organizations should present objective, evidence-based information and avoid speculative claims about health data, respecting both athlete confidentiality and audience expectations.
Conclusion Behavioral signals offer a multifaceted approach to measuring fan engagement, blending analytics, sensors, telemetry, biomechanics, and narrative elements tied to coaching and player health. When implemented with clear privacy safeguards and thoughtful visualization, these signals allow organizations to respond to audience needs in real time and to design experiences that align with demonstrated preferences. Effective measurement combines operational responsiveness with long-term analytical rigor, producing insights that inform both in-event decisions and broader fan engagement strategies.


